
The Org Chart
Vincent Depassier · September 3, 2026
Workforce → Org chart draws your workspace's people and agents as one picture: who belongs to which team, which teams sit inside which, and who leads them.
It is a map of a structure you build elsewhere. Nothing is created here — teams and members are managed in Workforce → Teams, and this page renders the result.
Four levels
Teams nest, and each one declares what kind of thing it is:
Level | Typically |
Division | The largest grouping |
Department | Inside a division |
Section | Inside a department |
Team | The working unit people actually sit in |
Nothing forces you to use all four, and nothing forces a strict order — the levels are labels, not a schema. A workspace with six people should use one level and stop.
The stats bar along the top counts what exists: divisions, departments, sections, teams, and then the two things that matter most — how many agents and how many humans.
Two kinds of member
A team holds humans and agents, drawn differently and counted separately.
Each member can carry a role label — Analyst, Reviewer, Contractor — and one member per team can be marked the lead.
Agents that belong to no team appear on their own, outside the hierarchy. That grouping is worth checking occasionally: an unassigned agent is usually one somebody built and forgot, and it is still consuming a slot in your plan.
The connections between people and agents
Beyond the team boxes, the chart draws lines between a person and an agent when a relationship exists, labelled with what it grants:
chat access — that person can talk to that agent
read access — that person can see it, not drive it
This is the part of the chart that answers a question you cannot answer from a list: who can actually use this agent? On a workspace with a dozen agents, the lines are the fastest audit available.
Arranging it
The chart lays itself out automatically the first time. After that it is yours to move:
Drag nodes anywhere. Positions are saved and come back next time you open the page.
Draw a connection by dragging between nodes, when the automatic layout missed a relationship you want visible.
Curve toggles between straight and curved connectors — cosmetic, but curved reads better on a dense chart.
Show map / Hide map toggles the minimap, which is what makes a large workspace navigable.
The layout is saved for the workspace, not per person: what you arrange is what your colleagues see.
What the chart does not do
Worth being blunt, because the empty-state text on this screen oversells it.
The agent runtime does not read your hierarchy. An agent does not know it reports to a department, does not consult its team lead, and does not route work up or down the chart. Reporting lines here are documentation for humans.
There is exactly one place the structure has a functional effect:
Knowledge packs can be bound to a team, and every agent whose team is that team receives that pack's context.
And one detail that catches people out: that binding is an exact match on the agent's own team. It does not flow down the hierarchy. A knowledge pack bound to a Division does not reach an agent sitting in a Team inside that Division — only agents whose team is the Division.
If you want a pack to reach a whole branch, bind it to each team in the branch, or bind it globally.
Practical guidance
Build the shape that matches how work is actually assigned, not your company's HR chart. This structure exists to make agent access legible.
Use one level until you need two. Divisions and sections on a ten-person workspace are ceremony.
Check the unassigned agents now and then, and delete or place them.
Read the access lines before granting a new one. They show what somebody can already reach.
Bind knowledge packs at the level agents actually sit at, because inheritance does not exist.
Next
Agent Tasks and Teams — creating the teams this page draws.
Agent Knowledge and Memory — what a team-bound knowledge pack contains.
Agent Access and Tools — what the access lines mean in practice.
What it looks like
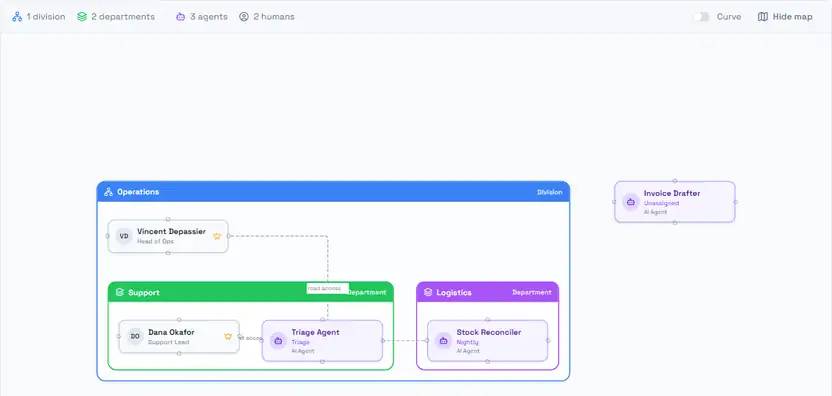
A small workspace, drawn.
The stats bar reads 1 division · 2 departments · 3 agents · 2 humans — the levels in use, then the two counts that matter. Nothing forces you past that; a workspace this size does not need Sections.
Operations is the Division, with Support and Logistics nested inside it. Each box is coloured by its own team colour, and the level is labelled in its top-right corner. Humans and agents are drawn differently, role labels sit under the name, and the crown marks the team lead.
Invoice Drafter floats outside the hierarchy: an unassigned agent, which is what this page suggests checking periodically.
The dashed lines are the access relationships, labelled read access and chat access. They are the fastest way to answer who can actually use a given agent — and they are the only thing on this chart that reflects a real permission.