
Plan Usage and Limits
Vincent Depassier · September 3, 2026
Every workspace runs inside a set of limits that come from its plan. Settings → Consumptions is the one place that shows all of them at once: what you are using, what you are allowed, and how close the gap is.
Read it before you get surprised, not after.
What the page tells you
At the top: your plan name and the billing period every monthly figure is measured over. That period is anchored to your billing cycle, not to the calendar month — so "this month" here means your month, and all the monthly metrics report over the same window.
Below it, one card per limit. Each card carries:
How much you have used, with its unit — rows, calls, users, credits.
A one-line description of what is actually being counted.
A percentage of the limit, or the word Unlimited when the plan does not cap it.
A usage bar that turns amber past 70% and red past 90% or over the limit.
A refresh button, because these are live counts and not everything updates the instant you act.
The cards are sorted by urgency
Not alphabetically, and not by category: highest percentage first. Unlimited metrics sink to the bottom.
That ordering is the feature. The card at the top of the page is the limit you will hit next, and you do not have to hunt for it.
What gets measured
Nineteen metrics, which fall into three shapes.
Monthly consumption — resets each billing period
Metric | Counts |
Automation Units | Work consumed by automation runs |
API Gateway Calls | Gateway calls processed for the workspace |
API Gateway Egress | Data served out through the gateway |
AI Agent Credits | Credits consumed by agent runs |
These are the ones that go back to zero when your period rolls over.
Standing totals — what exists right now
Metric | Counts |
Admin Users | Workspace members who are not inactive |
End Users | End users registered in the workspace |
Vault Secrets | Secrets stored in the vault |
Api Key | Active gateway credentials |
Forms | Forms available in the workspace |
Dashboards | Dashboards available in the workspace |
Apps | Apps deployed in the workspace |
Active AI Agents | Agents currently active |
Rows Per Workspace | Total rows across active tables |
Columns Per Workspace | Total columns across active tables |
Mail Queues | Active mailing queues |
Deleting things lowers these. Nothing resets them on a schedule, because they are not consumption — they are inventory.
Per-item maxima — the worst offender, not the average
Metric | Counts |
Rows Per Table (see below) | The largest single table |
Fields Per Form | The form with the most fields |
Widgets Per Dashboard | The dashboard with the most widgets |
Emails Per Queue | The queue with the most pending emails |
Origin Rules / Credential | The credential with the most origin rules |
These are easy to misread. The number is not a total — it is the highest single value in the workspace. "Fields Per Form: 38 of 50" does not mean you have 38 fields; it means your biggest form has 38.
When a metric works this way the card names the culprit: Highest usage currently comes from …, which is the difference between knowing you are near a limit and knowing which form to go and trim.
Going over
What happens at 100% depends on whether the metric supports extra consumption (pay-as-you-go past the plan limit).
Without it, the card turns red and says so plainly: usage of that feature is blocked until the next billing period or a plan change. A blocked automation does not run. A blocked gateway call is refused with a quota error rather than silently dropped, so the caller knows.
With it, work continues past the limit and the overage is billed. Two metrics support this today:
Automation Units — billed per unit
API Gateway Calls — billed per thousand calls
Each has an Enable extra consumption switch on its card, with the exact rate shown next to it. Once you are over the included allowance, the card also shows the estimated charge for this billing period so the number is never a surprise on the invoice.
Extra consumption is a per-plan capability, not a universal one. If the switch is disabled and reads Not available on your current plan, the only way past the limit is an upgrade.
Automation Units, broken down
The Automation Units card expands into a per-automation breakdown: every automation that consumed units this period, how many, and its share of the total.
This is the fastest diagnostic in the product for "why did we burn through our units". One automation on a tight trigger is usually the whole answer, and it is visible in two clicks.
Mail queues
Mail queues get a combined card, because the two limits only make sense together: how many active queues you may have, and how many pending emails any one of them may hold.
Hit the queue count and the card tells you the fix, which is not an upgrade: complete or remove the queues you already have. Queues are meant to drain.
Three limits that are enforced but not shown here
Worth knowing, because being blocked by a limit you cannot see is a bad afternoon:
Rows Per Table — enforced on every write, but the summary reports Rows Per Workspace instead. A single oversized table can be refused while the workspace total looks comfortable.
Custom Domains — enforced when you attach a domain to an App.
Mailboxes — enforced when you create a mailbox.
If a write or a create is refused for quota reasons and no card on this page looks close to its limit, it is one of these three. The error message names the limit it hit.
A caveat on the Api Key count
The Api Key card counts active gateway credentials, and revoking a key does not currently lower it. A workspace can therefore report itself at its limit while the keys in question are all revoked and unusable.
If that number looks wrong, it probably is. Removing the credential rather than revoking it is what frees the slot.
Practical guidance
Read the top card, not the whole page. The sort order means the first thing you see is the thing that will break first.
Trust the maxima cards' scope label. It converts "we are near a limit" into "this specific dashboard has too many widgets".
Refresh before drawing conclusions. These are live counts, and a figure you loaded ten minutes ago is ten minutes old.
Decide about extra consumption in advance. Turning it on after an automation has already been blocked does not retroactively run what was refused.
A red card with no overage switch is a hard stop. Plan the upgrade or reduce the usage; there is no third option.
Next
Usage & Quotas — the gateway's own view of calls and rate limits.
Agent Runs and Usage — where agent credits are actually spent.
Automations Overview — what consumes an automation unit in the first place.
What it looks like
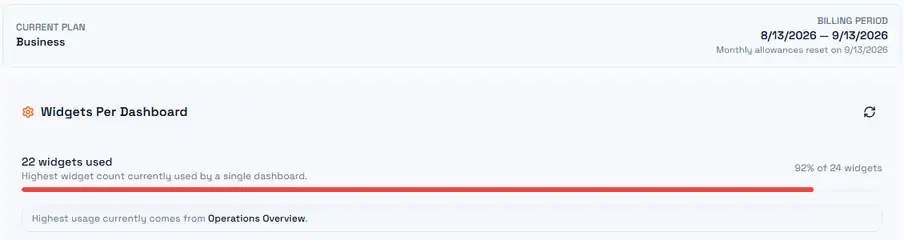
The header names the plan and the exact billing window, including the date the monthly allowances reset. Below it the cards are already sorted: the red bar at the top is a per-item maximum, and the line under it names the dashboard responsible.
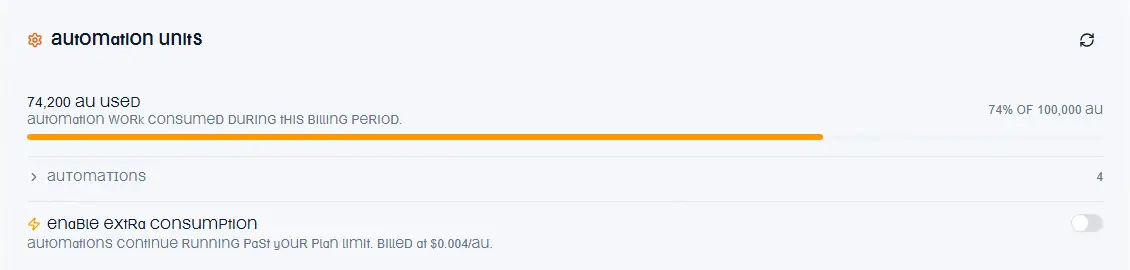
The Automations row expands into the per-automation breakdown, and the switch underneath is where extra consumption is turned on — with the exact rate stated next to it, never implied.
This screen is currently shown in English in every language: its text has not been translated yet.