
Logs
Vincent Depassier · August 30, 2026
Every request that reaches the API Gateway is recorded. Not a sample, not the failures — every one, including the ones that were rejected before any data was touched.
That makes the Logs tab the first place to look when an integration misbehaves, and the only place that can tell you what a caller actually sent rather than what they believe they sent.
You will find it at API Gateway → Logs.
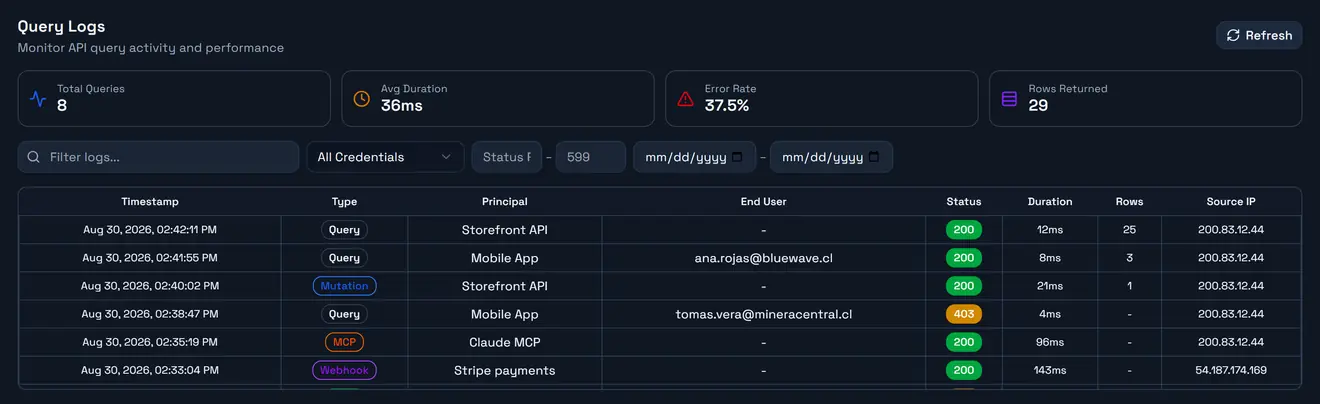
What a log entry holds
Field | What it tells you |
Type | Which surface was used — see below |
Principal | Which application called, by its display name |
Credential prefix | Which key of that principal, e.g. |
End user | The person, when the call carried an end-user JWT |
Auth type |
|
Status | The HTTP status returned |
Duration | Milliseconds spent executing |
Rows / bytes | How much came back |
Source IP and user agent | Where it came from |
Error | The message, when there was one |
Query body | The full payload the caller sent |
Response body | What was returned |
The last two are on the detail view rather than the list, and they are the reason the log is worth having: you can read the exact JSON a caller sent, which settles most "the API is broken" conversations in about ten seconds.
Logging happens after the response is sent, so it never slows a request down.
The five types
Type | Covers |
| PraxQL reads |
| PraxQL writes |
| Inbound calls to an endpoint |
| End-user register, login, refresh, password operations |
| Tool calls from an AI connector |
Having them separated matters more than it sounds. A workspace that looks busy is usually busy in one of these five ways, and the type column tells you which without reading a single payload.
Auth types, and what they imply
Auth type | The caller was |
| A backend holding |
| A browser or app holding |
| An end user, with their own session token |
| An end user, whose app also identified itself with a publishable key |
The presence of an End user on a row is the useful signal: it means the request was subject to that person's role scopes and row filters, not to a credential's. If a row you expected to be filtered shows no end user, the call was made by an application key and no per-user filter applied.
Filtering
The list filters on credential, end user, status range, and a date range, with free-text search over principal, end-user email, source IP and error message on top.
The status range is the one to reach for first. 400–499 is every rejected request; scanning that is how you find a client that has been failing quietly for a week because nobody watches its logs.
What never appears here
Three things, all deliberate:
Playground runs. Executing a query in the Playground writes nothing to the log and does not count against your quota. If you are debugging by watching this tab, a Playground run will never show up — call the endpoint for real.
Automation internals. A webhook shows one entry for the inbound call. What the subscribed automations then did is in the automation run history, not here.
AI conversation context. An MCP entry records the tool call — which table, which operation — and not what anybody typed to the assistant.
Logs cannot be deleted
There is no delete, and no bulk purge. That is what makes the log an audit trail rather than a debugging convenience: an entry cannot be removed by whoever caused it, including an administrator.
Debugging with it
"The integration stopped working." Filter by its credential and sort by newest. If there are no entries at all, the request never arrived — that is a URL, DNS or firewall problem on their side, not a permissions problem on yours. If there are entries, the status tells you which layer refused them.
"It works in the Playground but not from my app." Almost always one of three things, and the log distinguishes them: a 403 SCOPE_VIOLATION means the credential's scopes differ from the one you tested with; a 401 means the key is wrong, expired or revoked; and no entry at all means your app is not reaching the gateway.
"We are being rate limited." Filter on status 429. The pattern in the timestamps tells you whether it is a steady overload or one client in a retry loop.
"A customer says they see someone else's data." Filter by their end-user id. Every entry shows what they asked for and what came back — and whether their role's row filter was applied at all.
A `403` with no end user on an end-user-facing call is worth a second look on its own: it usually means the app fell back to its API key somewhere, and per-user isolation was silently not in effect for that request.
Next
Usage and quotas — what these calls cost and what happens at the limit.
Security Model — the layer each status code corresponds to.